Traders are preparing for market swings at the end of the month as the MSCI indexes rebalance, with liquidity continuing to migrate to the US and APAC – and out of Europe.
A total of US$16.5 trillion in AUM is benchmarked to MSCI indices worldwide, and more than 1,400 ETFs are linked to them. These latest changes to indices will come into effect from 28 February.
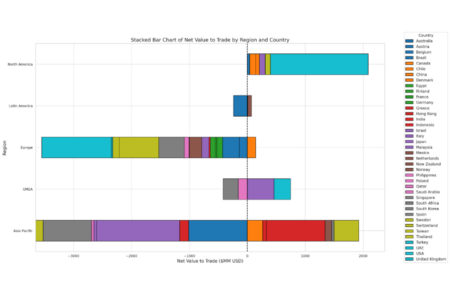
North America has the strongest net value to trade in the current indices, according to Barclays data, with more than US$2 billion of stocks needed to be bought to match the new weightings. APAC is not far behind with just under US$2 billion, led by India’s more than US$1 billion in net value, but is counteracted by almost US$4 billion in negative value, primarily from Japan, South Korea and Australia.

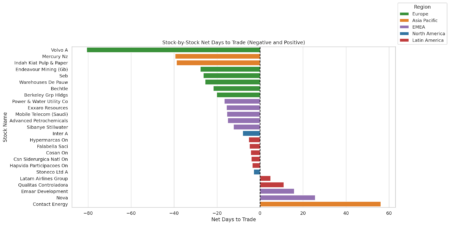
Europe floundered, with more than -US$3 billion net value to trade and approximately US$10 million to sell. Only Denmark has displayed a positive performance in the region. The majority of stocks with the most pressure to sell are European, with Volvo A far ahead of the pack at -80 days. This suggests that it would take 80 full days of trading for the company to match new MSCI weightings.
The runner-up, APAC’s electricity generation company Mercury Nz, came in at -40 days – less than half the automobile company’s figure – and with net -US$159.10 to trade for rebalancing. At the opposite end of the spectrum, New Zealand’s Contact Energy is firmly in the positive with close to 60 net days to trade and net US$262.50 to trade to meet the new ratings.

The MSCI stock with the greatest expected flow is currently Japan’s Toyota at close to -US$1 billion, followed by US Mag7 favourite Apple at more than -US$750 million. Chinese consumer electronics firm Xiaomi Corporation, on the other hand, saw almost the opposite story with more than US$700 million.

The largest of the 23 new entrants to the MSCI World Index are United Airline Holdings, Reddit A and Natera. All US companies, they are valued at US$33.98 billion, US$37.53 billion and US$22.41 billion respectively.
Of the global indices, only the MSCI World All Cap Index is seeing a net addition in securities this month, with 111 added and 90 deleted. The ACWI Small Cap Index is losing more than 100 securities overall (193 added, 297 deleted) as is the ACWI Investable Market Index (gaining 193 securities and losing 312).
The Frontier Markets Small Cap Index has seen additions at a faster rate than its global counterpart, seeing 22 additions to 12 deletions. Pakistan had the most securities removed from the index, losing four and gaining three, while Vietnam added four to the index and lost one.
Elsewhere, Hyundai Motor India (US$16.9 billion), the UAE’s Emaar Development (US$14.8 billion) and China’s J&T Global Express B (US$7.1 billion) are the largest securities by market cap to join the Emerging Markets Index. In the Frontier Markets Index, Croatia’s Koncar Elektroindustrija, Morocco’s CFG Bank and Kenya’s Standard Chartered Bank lead the way.
MSCI noted that securities classified in Bangladesh have not been subject to change during the review due to market accessibility issues.
©Markets Media Europe 2025

