Short interest in S&P stocks is at a record, as bearish sentiment builds on mega-cap tech companies.
Short interest has remained elevated following the 2024 US presidential election. The dollar value of equity shorts in the S&P500 hit an all-time high at US$820 billion at the end of 2024 compared to US$584 billion at the end of 2023. This is growing faster than long equity margin data as shown by FINRA margin statistics, going from US$ 700 billion at the end of 2023 to US$890 billion at the end of November 2024 or the index which returned 23% last year.

While the dollar numbers are dramatic, short interest as a percentage of daily trading volume – or the days-to-cover ratio also shows significant growth. Expressed as a simple average, the S&P 500 index cover ratio reached a record high of 4.15 days in September 2024.
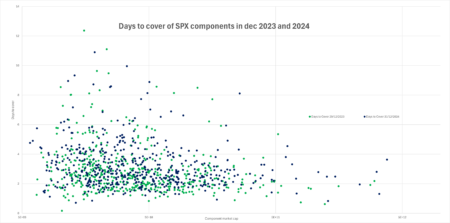
Since then, this equal-weighted cover ratio has fallen, while the market cap-weighed average has increased. This reflects a convergence of cover ratios between lower and higher market cap stocks. Thus, stocks with a market cap below US$50 billion had on average short cover ratios of 3.1 days at the end of 2023, while for market caps greater than US$50 billion, the average was 2.5 days. At the end of 2024, the respective cover ratios were 3.3 days and 2.8 days.
This trend can be seen in individual names which are being much more actively shorted. For example, Apple’s short interest was 3.63 days at the end of 2024 versus 2.1 at the end of 2023, while for Microsoft the cover ratio was 2.8 at the end of 2024 versus 1.9 at the end of 2023. Short interest in AI chipmaker Nvidia also reached a record high at the end of 2024.

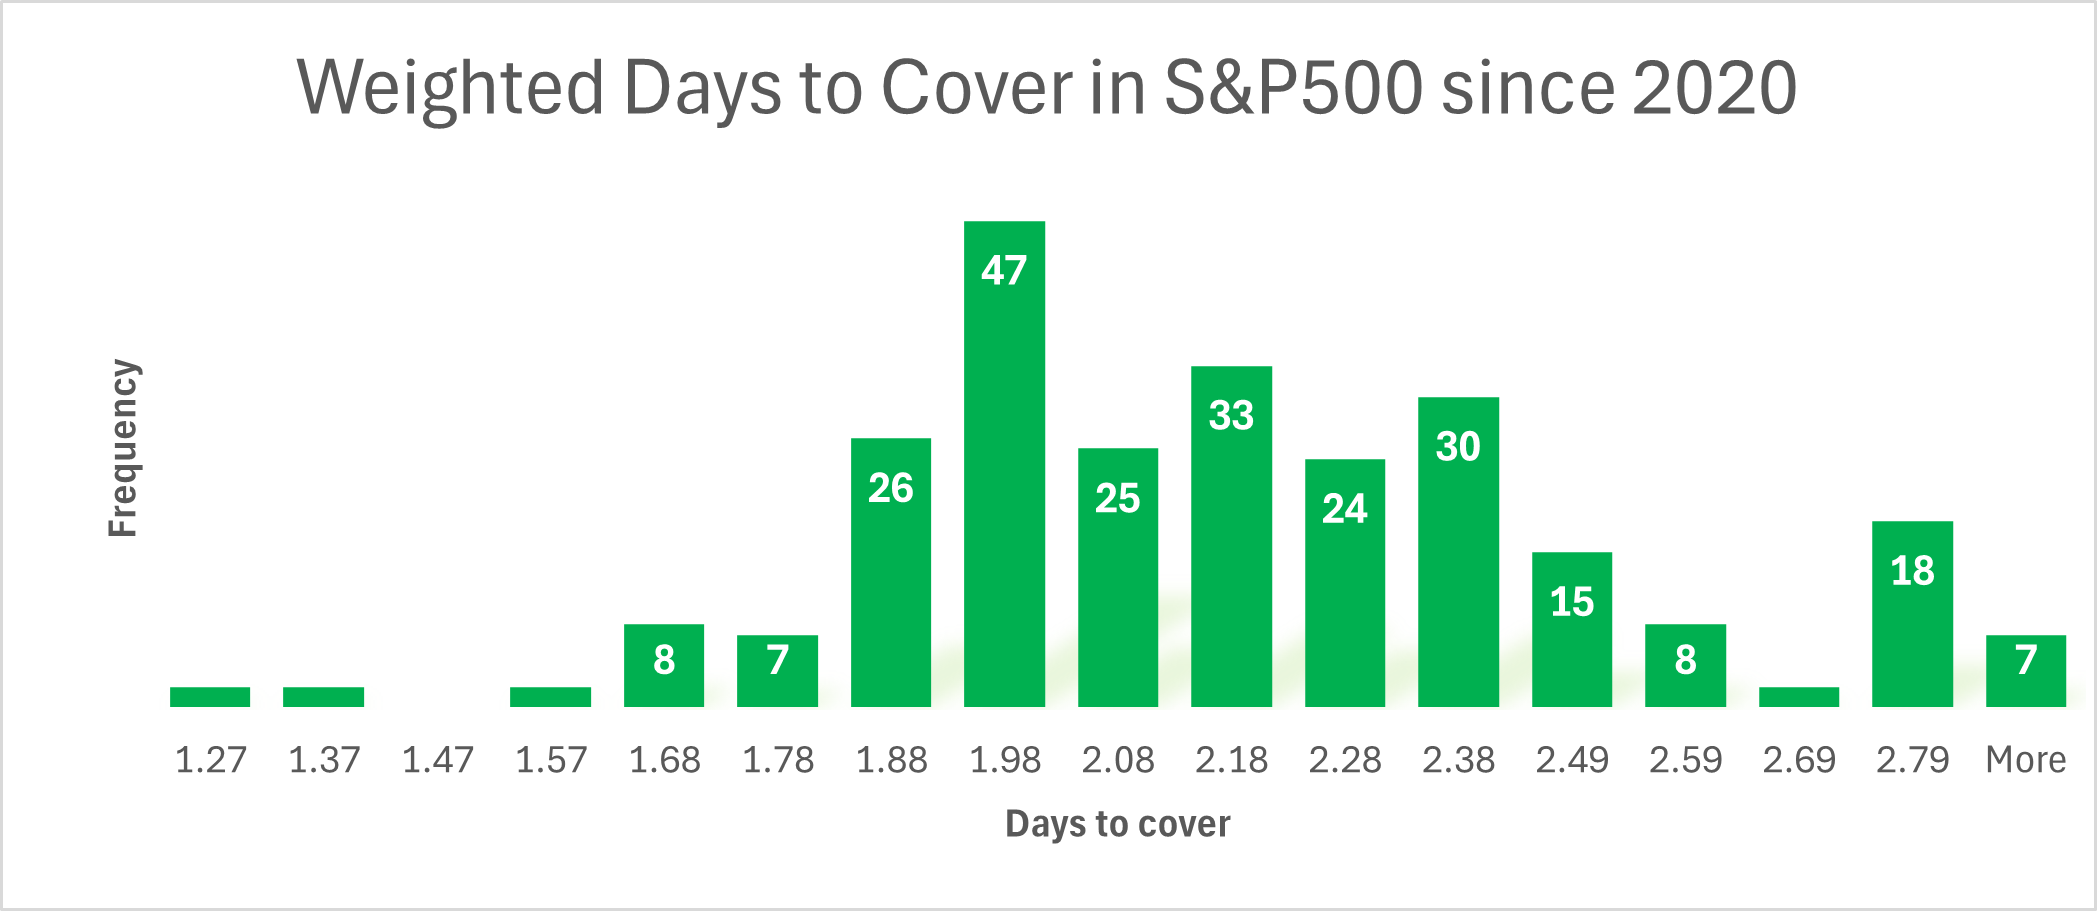
Historical trends since 2020 indicate short interest is high now having trended higher since the beginning of 2023, with the weighted average hovering around 2.75 days to cover. The frequency distribution of the S&P aggregated days-to-cover ratio since 2020 reveals a rightward skew, with a significant cluster of observations requiring between 1.8- and 2.5 days to cover and a long right tail extending beyond 2.79 days. At the beginning of 2025, 57 components of the S&P 500 had a days-to-cover ratio greater than 5 days versus 50 at the beginning of the previous year.

Notably, at the end of December 2024, the data points out continued advances in short positioning since 2023, despite the index’s continued advance and resilient bearish activity, particularly in smaller constituents. Nate Anderson at Hindenburg Research might have disbanded for personal reasons but the short side of the US equity market is powering on.
Read more: https://www.globaltrading.net/traders-prepare-for-price-drops-as-short-selling-spikes/
©Markets Media Europe 2024

