


Depth of order book collapsed as liquidity providers fled unprecedented volatility, Global Trading analysis shows.
In a market rocked by tariff uncertainties and extreme volatility, the liquidity of e-mini-S&P 500 index futures, traded on CME, showed an extraordinary collapse in order book depth over the two-week period before 11 April. The reduction in liquidity of US stocks over the same period was more modest, Global Trading analysis shows.
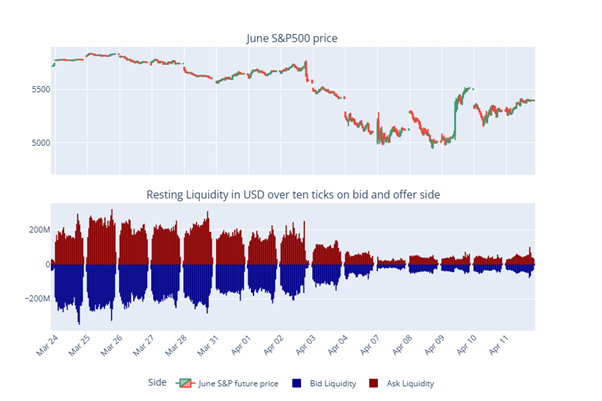
Detailed measurements averaged over 15 minutes period between 24 March and 11 April show that during normal trading hours, from 2pm to 10 pm BST, liquidity resting across the first 10 ticks on the bid and offer of the CME lit order book experienced a dramatic withdrawal in just a matter of days.
Using Level 2 order book data, this liquidity is expressed in the number of limit order contracts placed on the bid and offer side within the first ten ticks away the market price. Multiplied by the contract value and index price, this gives a dollar amount for available S&P futures liquidity.
Robust liquidity beforehand
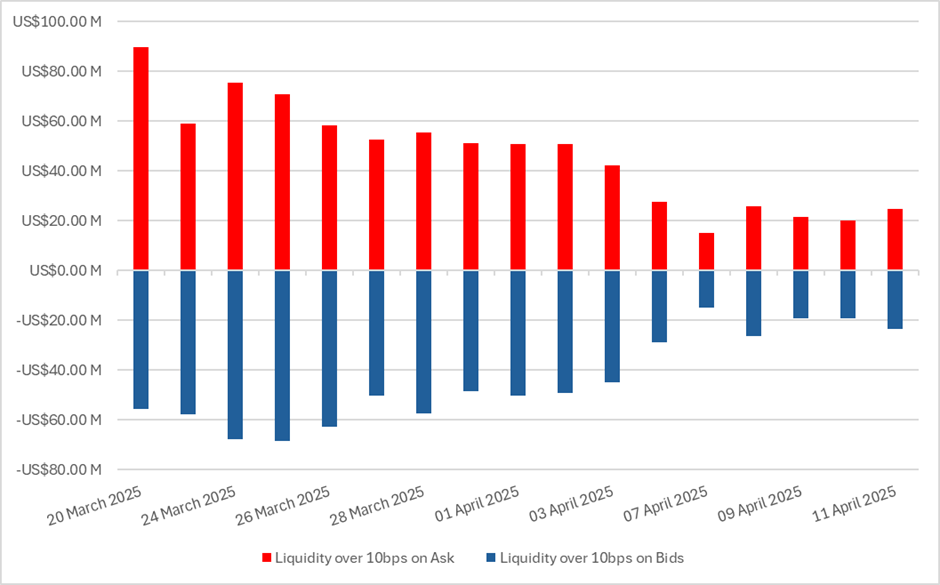
From 24 March to 28 March, liquidity on the bid and ask on cash equity open was around US$250 million and up to US$350 million on the cash close. In contract terms, that represents between 800 to 1100 limit order contracts resting passively in the book.
Available futures liquidity started to decline abruptly on 31 March, showing a decline between US$150 million to US$250 million by the end of trading.
A collapse after ‘Liberation Day’
However, the real change came after the US introduction of tariffs on 2 April, or ‘Liberation Day’. This led to a substantial decline in passive liquidity as measured by limit order depth.
On 3 April, during the 15 minutes after the cash open, resting liquidity on the first ten ticks on the bid and ask was only around US$100 million. This drought worsened despite the administration U-turn on some tariffs, with the VIX index reaching highs of 57 and staying above 30.
By 10 April, resting liquidity on open and close was barely 10% of what it had been only ten days prior. With liquidity on the first 15 min post cash open at US$40 million on the bid US$48 million on offer, respectively US$ 45 million on bid and US$34 million on offer in the 15 minutes into the close of US equities, liquidity resting in the order book has all but disappeared.
While passive liquidity waned, the need for liquidity increased. Contracts traded rose by more than 60% between 25 March and 7 April, from 1.02 million to 3.5 million contracts traded on the day. This liquidity supply-demand imbalance on CME contributed to volatility.
When contacted by Global Trading for comment on the findings, CME stated: “Our markets are operating with exceptional resilience in a period of tremendous uncertainty and record volumes.”
A less pronounced change in stocks
Global trading also looked at the evolution of US cash equities liquidity, as measured by available limit order offer and on demand 10 basis points away from the NBBO.
While this analysis was only conducted using daily average data, it shows the average liquidity on the 100 biggest US stocks by market cap followed a similar pattern as the S&P 500 index future albeit in a less pronounced manner:
Data indicates resting liquidity over 10 basis points above and below the NBBO in cash equities diminished approximately 75% after 2 April for the 100 biggest stocks.
Citadel Securities, the largest US market maker, did not respond to request for comment.
