In 2022, despite robust secondary trading volumes, many buy-side firms are citing worsening liquidity conditions and dealers have seen falling trading revenues moving into the second half of the year.
Bond market liquidity has traditionally been supported by dealers who leverage their balance sheets to buy from or sell to their clients and later trade these inventory positions with other clients at a profit.
However, these sell-side firms face barriers to supporting liquidity provision for clients, due to the current market structure, regulatory limits and scale of current activity, and interest rate movements.
There are numerous indicators of strains on market functioning. For example, the Federal Open Market Committee (FOMC) began increasing the target interest rate on 17 March 2022 and in the intervening period, the Corporate Bond Market Distress Index (CMDI) has risen from 0.13 to 0.27, representing a change “from the 13th percentile to modestly above the historical median of bond market conditions,” according to Federal Reserve economists.
“Looking into the different types of corporate bonds by default risk, the high-yield (HY) index remains just below the historical median, but the investment-grade (IG) index is in the top quintile, indicating strains in market functioning,” they note.
To assess current conditions from the buy-side’s perspective, The DESK has spoken with 30 US asset management firms to gauge their access to liquidity, dealer engagement, use of data and e-trading.
Executive Summary
In fixed income markets, it is understood that pricing levels differ amongst market makers and clients. To minimise any bar-belling of results, our survey captured feedback from 30 mid-tier asset managers in the US fixed income market.
We found that their access to liquidity is considered to be between moderate and poor by the majority of respondents. A significant majority report that liquidity access has either worsened or significantly worsened over the past year. This is perhaps unsurprising given the well-documented lack of pre-trade transparency, the current rising rate environment, and shrinking balance sheets.
Despite respondents largely agreeing that access to liquidity has worsened, they often still seek out traditional trading routes. Generally, respondents said that they interact more frequently with tier one dealers than tier two dealers. As fragmentation and volatility persist, it is reasonable to believe that data and technology could level the playing field in terms of liquidity access through information aggregation and improved connectivity to dealers.
A majority of respondents agreed that trading larger sizes is the most difficult objective to achieve. Electronic trading is used far more for smaller trades and is used seldom (or never) for larger trades including blocks.
Generally, alternative routes for pre-trade liquidity analysis and for executing medium to large trades are not currently being used despite the upside they offer for traders and managers.
SURVEY RESULTS:
Access to liquidity
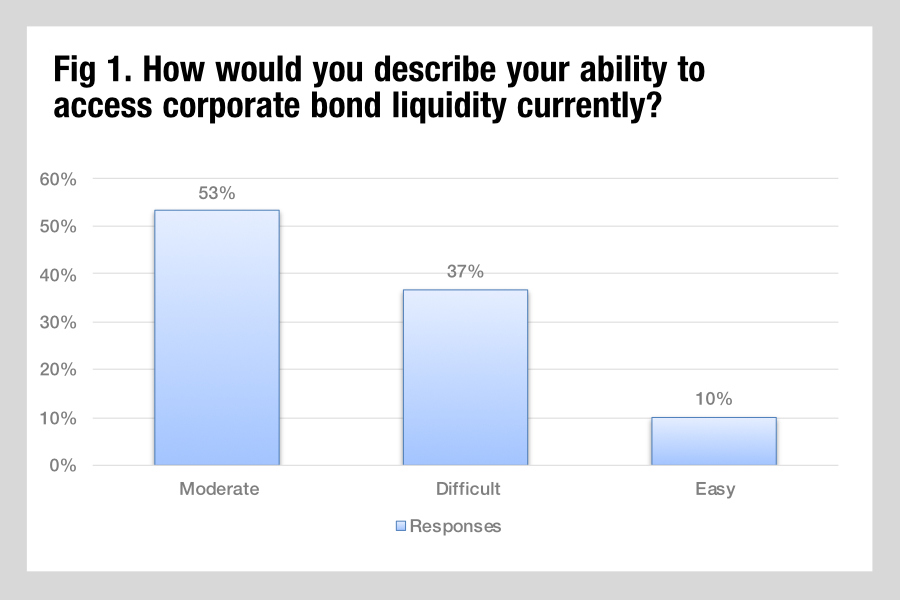
Bond traders have had a difficult year in 2022. Access to liquidity is cited as a major issue. Only 10% of respondents report that access to liquidity is easy, just over half (53%) assess it as moderate, and over a third (37%) report it is difficult (Fig 1).
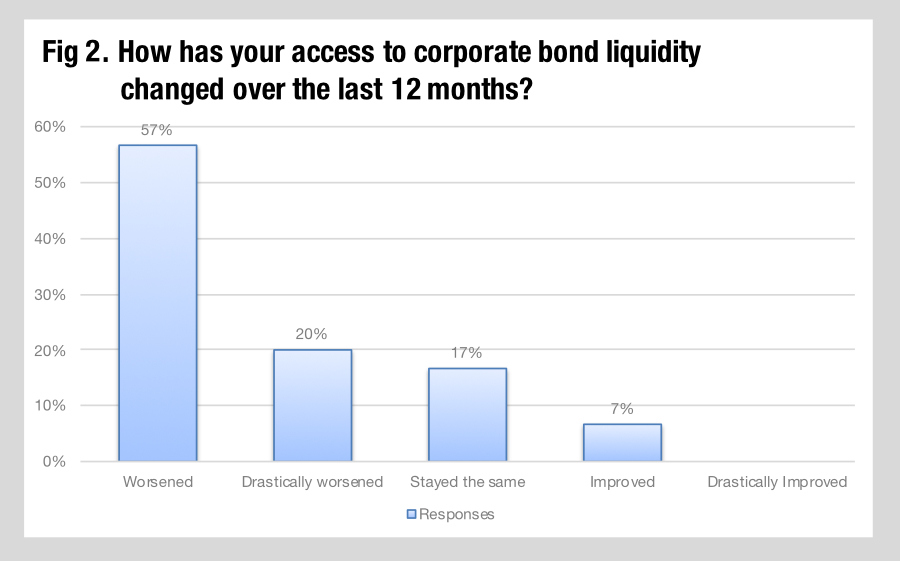
Seventy-seven percent of respondents said that access to liquidity had worsened, of which 20% indicated that access has worsened drastically. Seventeen percent of firms suggested they have not experienced change in liquidity conditions, but only 7% reported an improvement at the same time (Fig 2).
Liquidity discovery process
The way investors search for liquidity is changing. Electronic corporate bond trading is growing, indicating not only a willingness or need to explore new trading protocols, as well as sources of liquidity.
Research published by analyst firm Coalition Greenwich has found that electronic trading in credit had increased since 2021, with 40% of US investment grade trading and 34% of high yield trading conducted electronically in October 2022, up 7% and 9% respectively. Total average daily volume in October was up 12%.
Further research from Acuiti has found that 79% of dealers report their clients have increased electronic trading slightly or significantly this year.
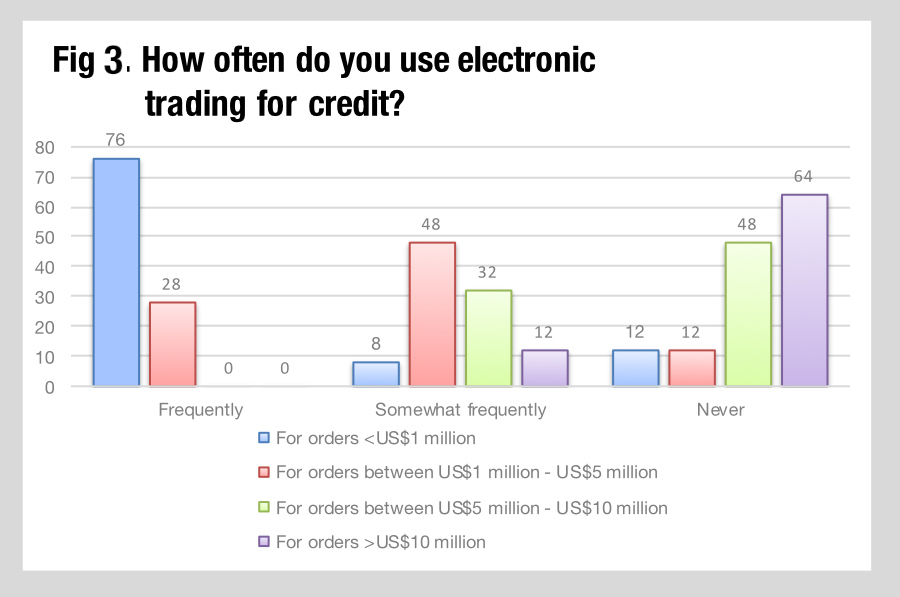
We found that most firms have adopted electronic trading, with only 12% of respondents reporting that they have never used electronic trading platforms before.
Orders less than US$1 million are frequently or somewhat frequently traded electronically by the vast majority of respondents. Orders between US$1 – 5 million are traded electronically frequently or somewhat frequently by over three quarters of respondents.
Perhaps unsurprisingly, larger orders are being traded electronically substantially less frequently, with 48% of respondents saying they never use e-trading for orders between US$5 – 10 million and 64% saying they never use e-trading for orders over US$10 million. Historically, larger trades tend to be the domain of voice/IB trading, while electronic trading lots tend to be much smaller (Fig 3).
What was not clear is whether the lack of wider e-trading adoption for blocks is due to previously unsuccessful efforts to trade larger sizes in the past, or if a dearth of e-platforms for trading larger sizes hindered their ability or interest in doing so.
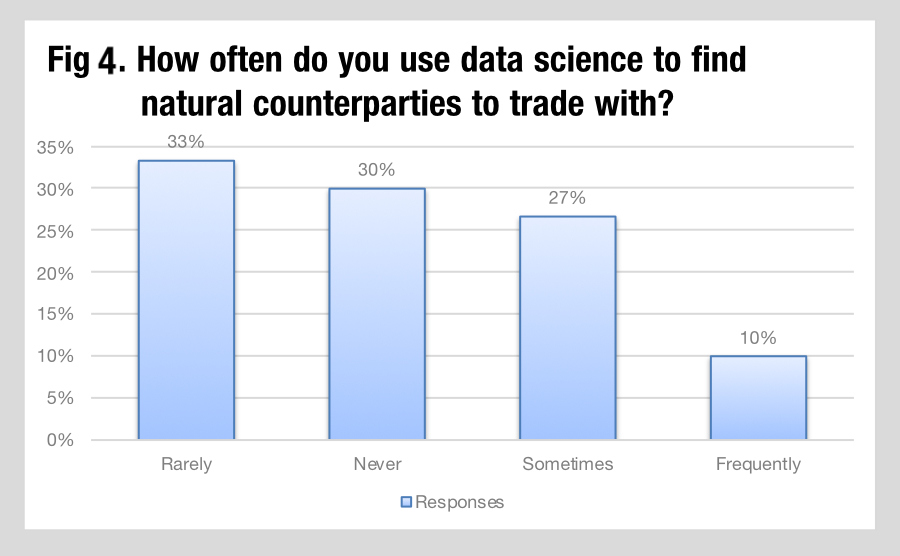
While the adoption of technology for executing smaller trades continues to increase, most respondents have yet to incorporate data science into their liquidity discovery processes. Efforts to use data science to assess liquidity and find natural counterparties pre-trade appear to be limited, with 63% either rarely or never using data science in this respect. Only 10% of respondents were frequently using data science in this way, with 27% sometimes using it (Fig 4).
Execution objectives
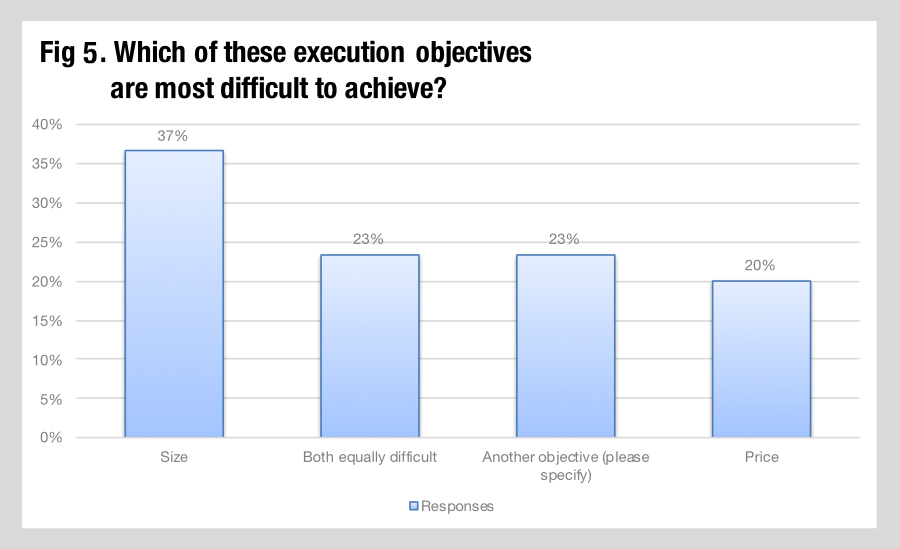
Liquidity can be measured differently based on execution objectives. Size and price are two of the main components when determining the tradability of a bond. When asked which objective proved to be the most challenging, 37% said size, 20% said price, and 23% said both size and price. Alternatives were given by 23%, with different parameters including , ‘Getting a bid when the market moves’ and ‘High dollar or non-index eligible securities’ (Fig 5).
Who provides liquidity?
As buy-side firms come under increased commercial pressures including reduced margins on products and rising costs, they often need to rationalise their dealer relationships. Banks play a crucial role in running new deals in the primary markets, providing research and market colour, as well as providing secondary trading.
We looked at the level of engagement between survey respondents and Tier 1 dealers and mid-tier dealers. We consulted with participants on how and why they engage with the sell side.
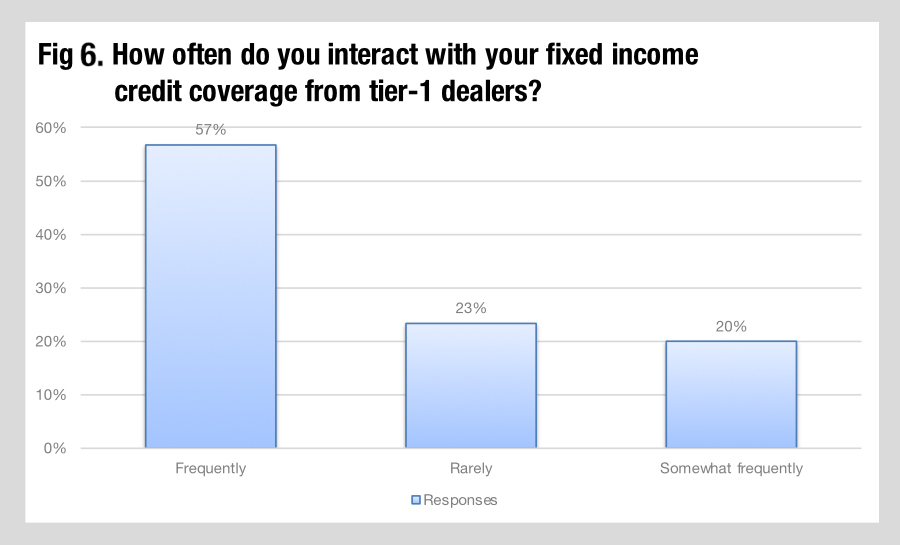
Most respondents interact with Tier 1 dealers frequently, whether that is for access to new issues or for secondary trading of bonds. The level of firms who rarely interact with these dealers – 22% – could represent the level of buy-and hold activity they engage in, or even the limited coverage they get from their dealers.
With 77% engaging either frequently or somewhat frequently, Tier-1 sell-side firms are getting the lion’s share of interactions. (Fig 6)
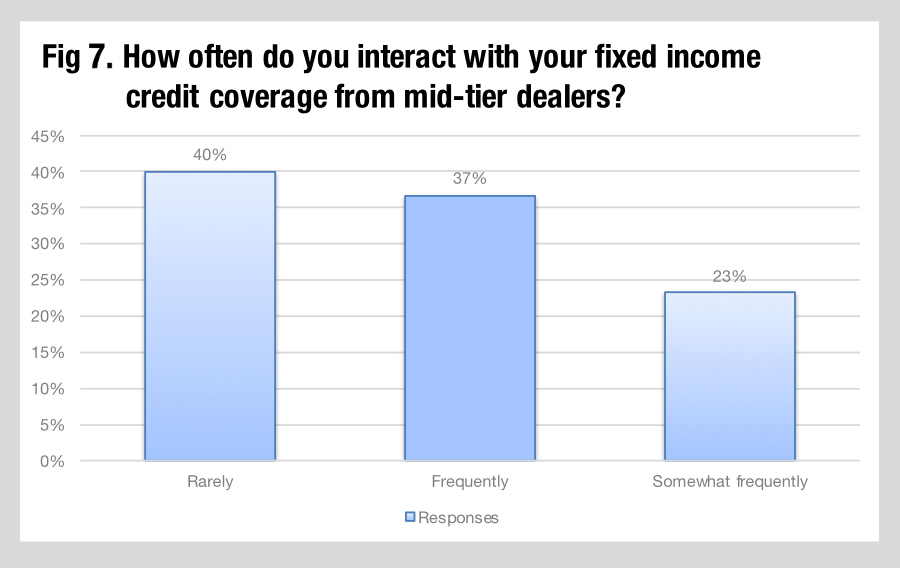
Interacting with mid-level dealers is less common, with 40% of asset managers rarely interacting with them. Only 37% reported interacting frequently with these dealers. In conversation with respondents, we found that this was in part due to the more limited and niche use for smaller dealers, their reduced size dealer lists and the level of primary activity that is taking place with Tier 1 firms. (Fig 7)
Respondents’ perspectives on engagement
Survey respondents were asked for qualitative suggestions on how they would improve fixed income credit coverage. Their answers fit in into roughly five categories: the breadth of information supplied, the relevance of information, aggregating information, balance sheet commitment and the ability to support the dealer-client relationship holistically.
In the first category, respondents said they need a greater breadth of names being covered with broader inventories and more opportunities being shown.
They shared concerns about the relevance of information, and examples of desired improvements included the quality of axes, more relevant trade ideas.
The need to aggregate information more easily was a challenge for several respondents, noting the number of screens/interfaces needed to access dealer information, and a preference for dealers to be more agnostic about where execution happens.
A desire to see more balance sheet commitment also proved an issue, one which has raised concerns across the industry. Dealers report that regulatory constraints, and costs imposed via regulatory capital ratios, are a major barrier to providing balance sheet for clients.
A final concern was the holistic relationship support which clients wanted, with a disconnect often reported between primary capital markets/investment banking and secondary market activity.
Demographics
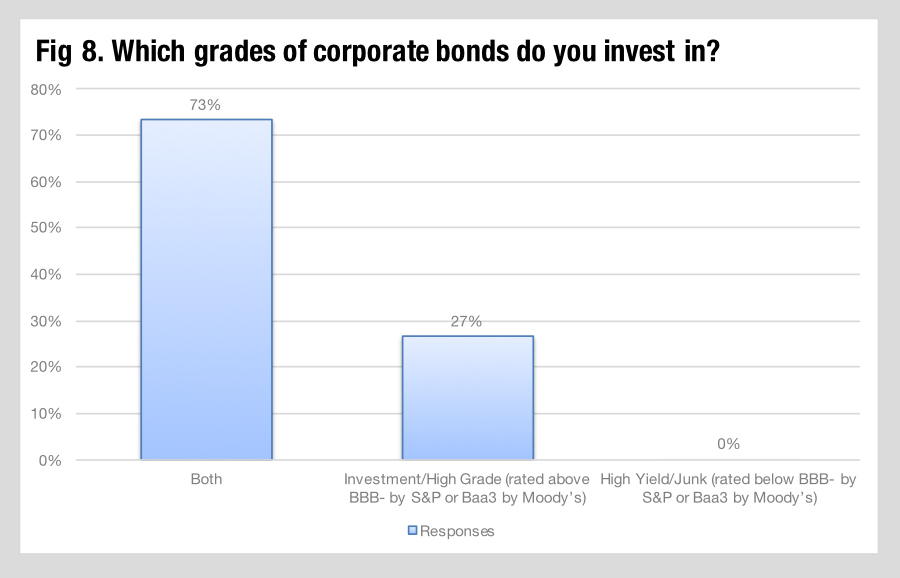
We surveyed 30 mid-level asset managers in the US, who primarily invested in both high yield and investment grade bonds.
How could firms improve access?
Based on the survey results, most mid-level asset managers have moderate to poor access to liquidity, with conditions worsening.
Buy-side clients have pinpointed pre-trade information, such as axes — or lack thereof — and balance sheet provision as leading challenges.
Electronic trading has helped by providing better access to sources of liquidity, but there is still much opportunity to improve with regards to using data science and new technology for more efficient liquidity discovery from natural counterparties and e-trading.
Larger trades tend to be the domain of voice/IB trading, with survey respondents reporting size as their most difficult execution objective to achieve.
“Exploring large-in-size trades though electronic means can open-up new channels to liquidity,” said one buy-side respondent. “That is incredibly valuable when liquidity is diminishing more broadly in the market.”
Even though e-trading is currently more focused on smaller trades, new e-protocols for block trading are emerging that could bring new efficiency to trading large orders.
Despite the rise of data-informed e-trading solutions, data science is currently used very little to find natural counterparties to trades with. Data science has the potential to allow more accurate provision of services from dealers to clients, with more targeted participation allowing for minimized information leakage, resulting in more efficient trading for the sell side and buy-side.
Conclusion: E-trading and data science critical in fragmented market environment
The fragmented dynamics of the corporate bond market mean that connection and information are critical. Effective engagement with dealers across the sell-side community is imperative. The need to execute large orders quickly and efficiently is more pressing than ever.
According to one buy-side respondent, “When traditional methods of engaging with the market are not leading to execution, the trading desk must consider how else to find liquidity. That could include better pre-trade analysis, more effective use of electronic trading.”
Based on insights from the survey respondents, the opportunity to leverage electronic trading tools and data science has only become more pressing given the challenging market environment.
©Markets Media Europe 2022

