The six biggest Wall Street banks have accumulated vast equity cash and derivative portfolios. Using Federal Reserve filings, we reveal their portfolio size, hedging strategies and risk exposures – but now a proposed regulatory change might throw all this on its head. Nick Dunbar reports.
In cash equity trading they may have lost their lead as liquidity providers to the likes of Citadel Securities and Jane Street, but the Wall Street banks still play a central role on the sell-side. Regulated by the Fed, they can deploy leverage and act as principals, taking strategic equity exposure shunned by quant trading firms.
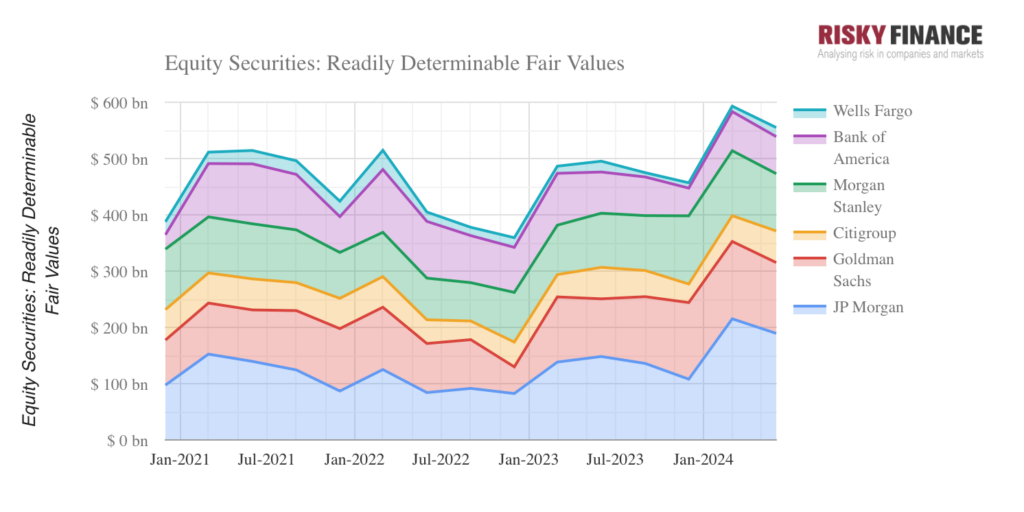
As markets have risen, so has the value of these equity exposures, reported quarterly in Fed filings. In the first quarter of 2024, equity holdings reached US$600 billion, led by JP Morgan with US$215bn and Goldman Sachs with US$137bn followed by Morgan Stanley, Bank of America, Citigroup and Wells Fargo.

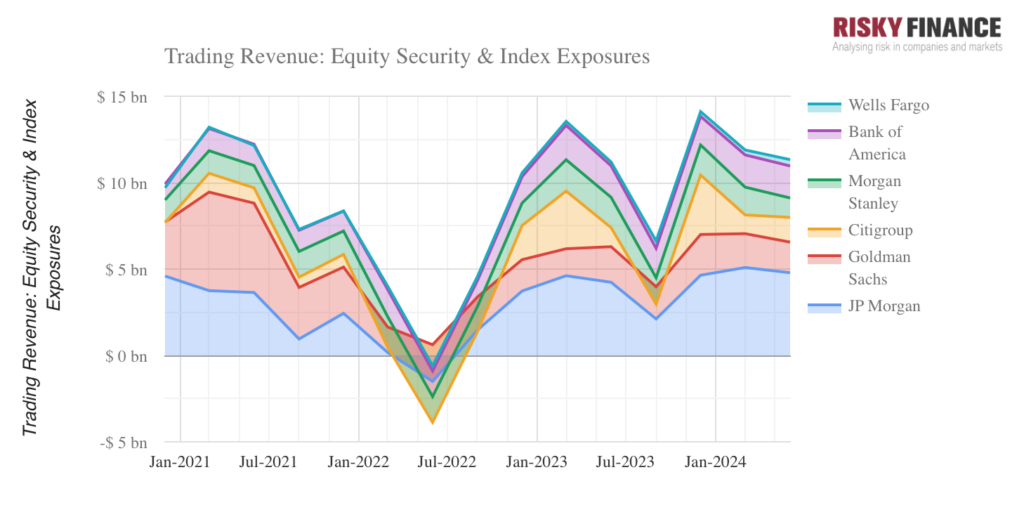
These equity holdings generate substantial trading revenue, totalling around US$11bn for the six banks in the second quarter of 2024, according to the filings. JP Morgan is in the lead here too, with US$4.8bn equity trading revenues in Q2, followed by Bank of America with US$1.8bn. Using the Federal Reserve data, we can see that these trading revenues are volatile, much more so than the banks’ published quarterly results.
For example, in Q2 2022, Citigroup suffered an equity trading loss of US$4.5bn according to the Fed’s data. But not in the bank’s quarterly earnings and 10-Q filings, in which Citi reported positive equity markets revenues of US$1.2bn in the same quarter. Clearly something is missing and the answer is derivatives.

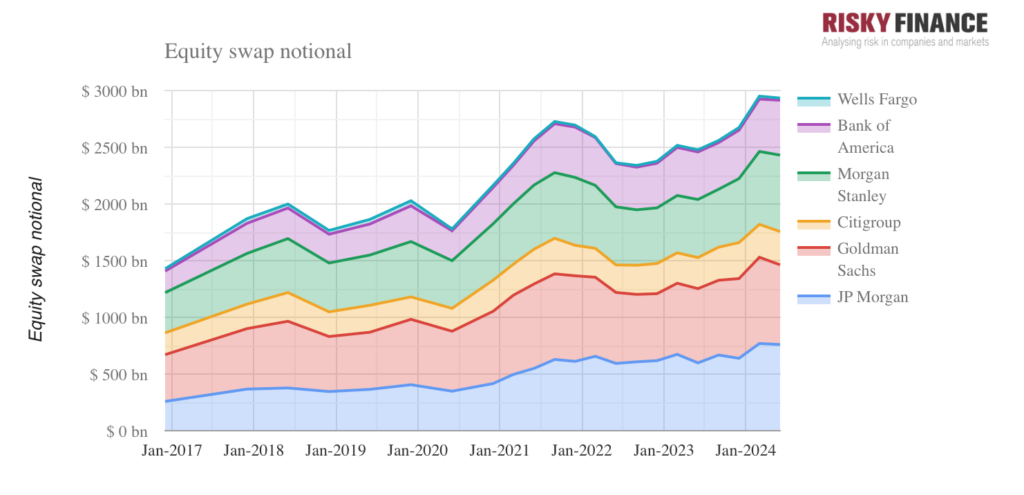
Equity derivative positions dwarf the cash equity positions of the banks in notional terms, although contracts such as index futures and options are not really comparable because notionals do not reflect their market value.
As opposed to options or futures, equity swaps are more comparable because they most closely replicate a physical stock holding, and hedge funds use them for this purpose. But there is a catch. The contracts are symmetrical – a counterparty on one side is effectively long the stock, but the on the other side the counterparty is short.
In the Fed filings, long and short equity swap positions are lumped together. JP Morgan reported US$759 bn of equity swaps in Q2, and Goldman had US$702bn. But we do not know how much of this was long exposure that can be added to the bank’s physical stock holdings.

We can try and unpick how much money the banks make on these derivatives by looking at two more lines in the Fed disclosures – ‘positive fair value of equity derivatives’ (where a bank is owed money on the contracts) and ‘negative fair value of equity derivatives’ (where the bank owes money) The change in these numbers from one quarter to the next would tell us something about a bank’s derivative profit and loss, if the contracts were fixed in place.
In reality, these contracts are changing all the time, as old ones expire and new derivatives are added, making a P&L estimate impossible. In the case of Goldman, both positive and negative-valued equity derivatives have increased over the past two years, but negative-valued derivatives have increased the most, suggesting that the bank has added short positions to hedge against rising equity markets.
Value-at-risk
To get a better idea of the actual risks the banks are taking with these trading portfolios, we need to look at a different area of Federal Reserve disclosures – the market risk filings. These follow an approach that started in the 1990s, looking at the statistical nature of trading books – an approach which is now widely used among both sell-side and buy-side firms.
Rather than take a snapshot of portfolio size or trading P&L on a particular date, banks assess the distribution of daily P&L during a specified time window (such as 100 days), sorting them from worst to best. The dividing line between the worst day and the other 99 less-bad days is called the value-at-risk or 99% VaR.
In the Fed’s market risk filings, the banks report VaR for individual asset categories such as equities or interest rates, and for the trading book as a whole. Rather than for a 1-day loss, these VaRs are for 10 days, so the numbers have to be divided by the square root of ten to convert them into a daily VaR. Then the regulators ask them to report backtesting results – the number of days that trading losses exceeded the VaR estimate. There are 63 trading days per quarter, so these 1-in-100 day events should happen once every two quarters or so.
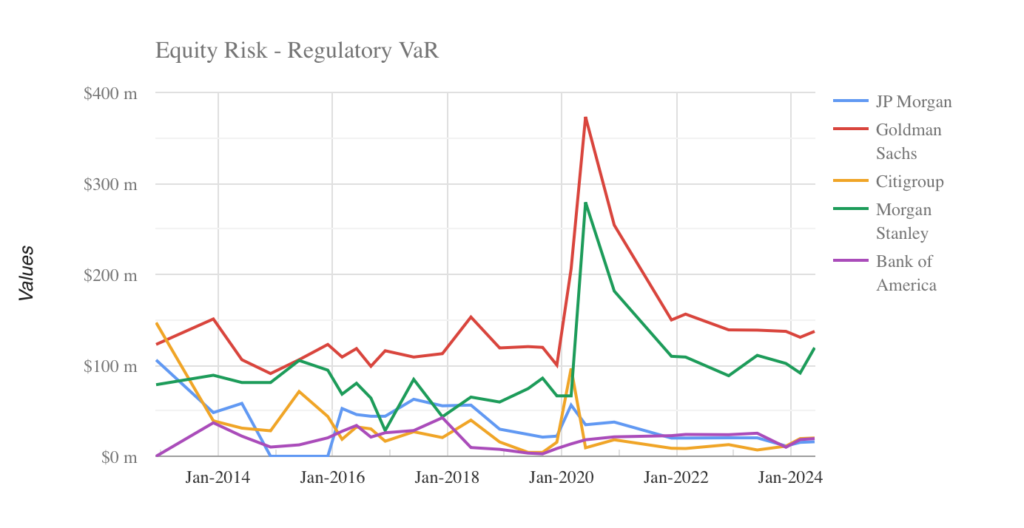
It is in the VaR and backtest numbers that the personalities of the banks reveal themselves. So, while JP Morgan may have the largest equity trading portfolio, Goldman has the largest equity VaR of US$137m in Q2 2024, followed by Morgan Stanley – reflecting both banks’ leading roles as market makers and capital markets specialists. That requires them to take outsized positions (such as for M&A deals or block trades) that expose them to greater risk.

This also reflects their ability to hedge. Index hedges are most liquid, but are the least effective at hedging the risk of a stock like Nvidia. An outright short would be the best hedge for a single stock, but is either impossible e.g. for an initial public offering (IPO), or would undermine the business model of the investment banks which requires them to hold a clients’ stock with minimal market impact. Citigroup, with an equity VaR of just US$20m, is clearly not trying to play this game.
The backtest data shows not just the number of days per quarter that the banks’ daily losses exceeded their VaR, but also how much greater than VaR these losses were. So the last time that Goldman reported a VaR exception, in Q1 2023, we learn that this loss was 215% of its VaR on that day (the Fed does not tell us whether this loss was in equity trading or another asset class). Using Goldman’s average VaR of US$484m for that quarter as a proxy, that suggests a loss of US$330m (dividing by the square root of ten to convert the 10-day VaR to daily VaR). Morgan Stanley lost US$217m on one day in the same quarter, using a similar analysis.
Although the banks may recoup these losses on other trading days, delivering profits for shareholders, VaR has a direct impact on them, via the Basel capital rules for market risk. Including a VaR-based capital requirement works as an incentive to reduce VaR, in order to reduce capital and increase dividends and share buybacks.
A year ago, the Fed threw all this into play with its Basel Endgame proposals – so-called because these were supposed to be the final US version of Basel III bank capital rules. The Fed wanted to abolish VaR for regulatory purposes, because of a well-known problem with VaR: It only measures the dividing line between the worst day and the less-bad days, not the amount you actually could lose on the worst day.
An example of this problem can be seen in Citigroup’s results for Q4 2023, when it reported a backtest exception. According to Fed filings, the actual loss on that day was eight times the bank’s VaR number, which averaged US$285m, implying a 1-day loss of US$720m. Such an extreme outcome would worry regulators. To plug this gap, the Basel Endgame would replace VaR with the expected loss on the worst day – which would force the banks to allocate a lot more shareholder capital to trading portfolios.
Over the past 12 months, banks and industry groups have lobbied hard against the endgame, even paying for advertising spots in the American Superbowl football tournament. The Fed promised to soften the proposals, and on 10 September, Fed vice-chairman Michael Barr confirmed that the credit and operational risk components of the Endgame would be dramatically scaled back – but not the market risk component. Traders and risk managers everywhere should take note.
©Markets Media Europe 2024

